
The Future of Housing Occupancy: Canada
Demographic Growth & Change
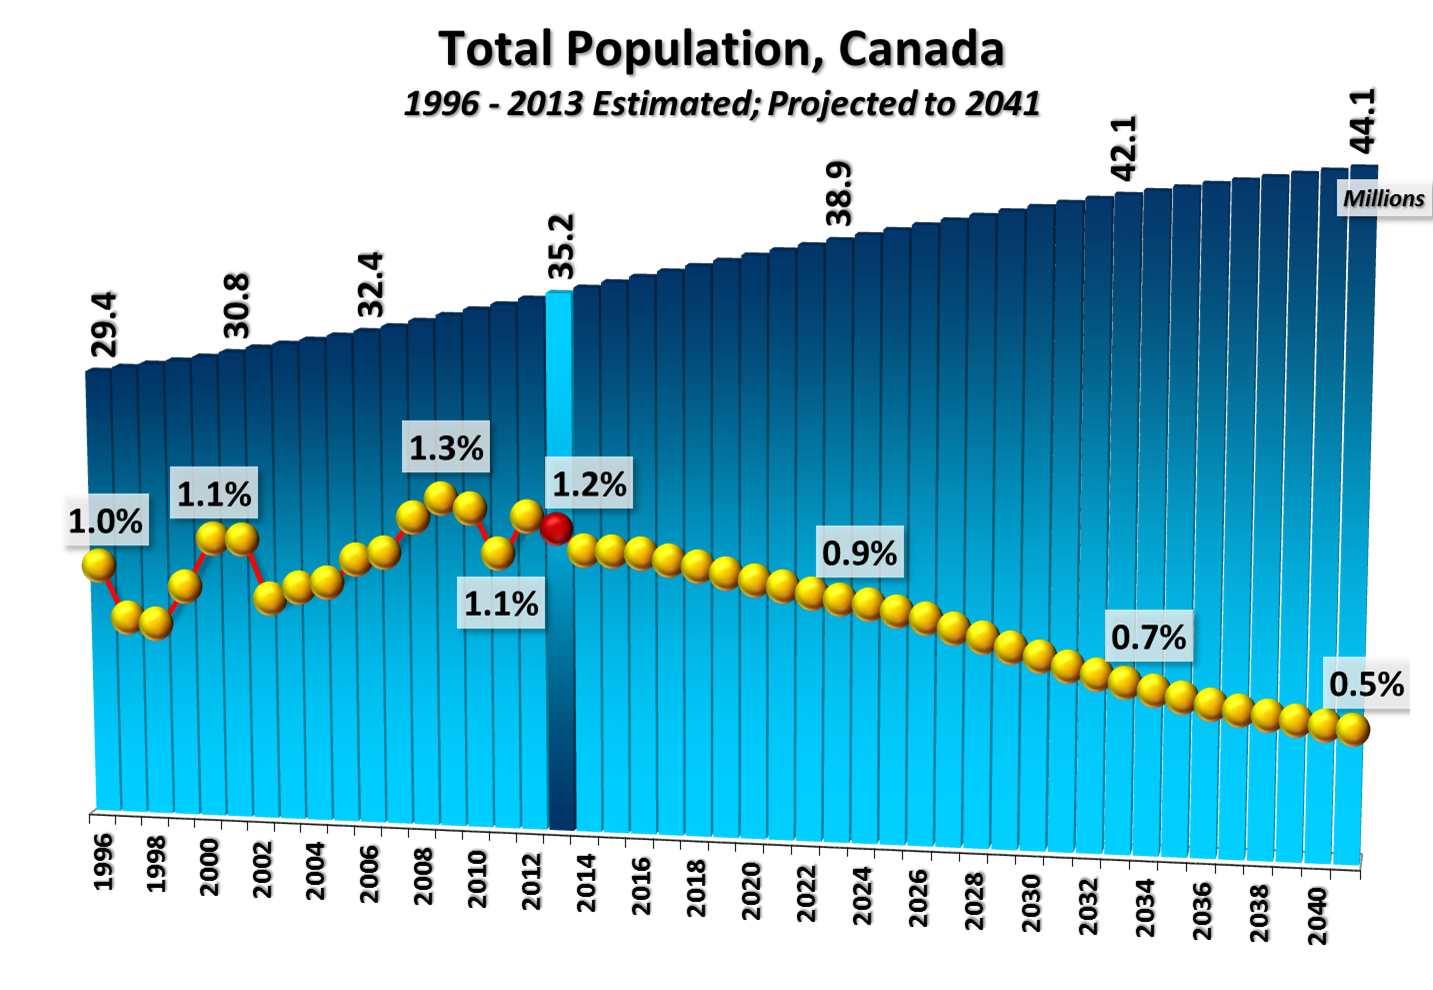
Over the past 17 years, Canada has added more than 5.8 million residents to its population, going from 29.4 million people in 1996 to 35.2 million by 2013 (a 20 percent increase). Growth has been steady, with year-to-year variations in the population’s rate of change having been relatively minor. In 1998 for example, the population expanded by 0.9 percent before increasing to 1.1 percent in 2001. By 2003, the rate of growth once again slowed, but only back to 0.9 percent. Over the next six years the population would grow at an increasingly faster pace, and by 2009, the growth rate would reach a two-decade peak of 1.3 percent. A period of slower growth followed, punctuated by the 2009 global recession. Annual growth in the national population fell to 1.1 percent in 2011 before increasing slightly to 1.2 by 2013.
Looking forward, the country’s population is projected to continue to grow, albeit at a slower annual rate than has been experienced historically. Over the coming 28 years Canada is expected to welcome 8.93 million new residents, growing from its current 35.2 million people to 44.1 million by 2041.
In annual terms, population growth would slow to less than one percent through the mid-2020s, before entering a period of even slower growth that would see the national population expand by only 0.5 percent annually by 2041. Despite expectations of relatively robust net migration, this pattern of slowing growth reflects Canada’s current demography and the aging of a large segment of our existing population (the post-war baby boom generation) out of the prime childbearing ages and into the higher mortality stages of the lifecycle.

With respect to compositional changes in our national population, the greatest relative growth will be in the older age groups. In fact, each of the 65-plus segments of the population is projected to grow faster, both relatively and absolutely, than any of the under-65 age groups. While the greatest absolute increase is expected to be in the 75 to 84 population (2.4 million more people by 2041), the greatest relative growth would come to the 85-plus age group (with 155 percent growth). Shifts in the composition of the Canadian population would see those aged 65 and older, who made up just 15 percent of the national population in 2013, increase to almost one-quarter (24 percent) of Canada’s population by 2041.
Looking ahead, it is important to bear in mind that the aging of today’s residents will, to a large extent, shape tomorrow’s population. For example, long and increasing life expectancies would see upwards of 82 percent of today’s residents still alive by 2033, and 73 percent by 2041.
Housing Occupancy Demand by Structure Type

The most recent Census and National Household Survey data reveal a distinct lifecycle pattern of housing occupancy in Canada. On the ground oriented side of the market (which ranges from traditional single detached homes to row houses, duplexes, and triplexes), a general pattern of increasing household maintainer rates is seen as youths move out of their parents’ homes and enter the labour force and family formation stages of life. Through the family rearing stage of the lifestyle rates for ground oriented accommodation stabilize in the range of 46 percent before declining after the age of 65, with some residents moving into apartments and, through the very oldest groups (85-plus), others transitioning into institutional and collective types of accommodation.
The lifecycle pattern of apartment living is weighted towards both younger and older residents. Apartment maintainer rates rise through the late-20s age groups, at which point they begin to decline as ground oriented rates grow, driven in part by the space requirements of growing families. Through the 40 to 69 year old age groups, between 12 percent and 16 percent of Canadian residents maintain households in apartments, compared to the 32 to 46 percent who maintain households in ground oriented units. As ground oriented rates begin to decline through the older age groups, apartment rates rise through each successively older one, peaking at 22 percent for the 80 to 84 segment of the population. As with ground oriented rates, declines characterize the oldest age group, with apartment rates falling slightly to 21 percent for those aged 85-plus.

By combining trends in the lifecycle patterns of age-specific household maintainer rates with the outlook for demographic growth and change, a demographically-based outlook for how housing occupancy in Canada would change in the coming decades can be made. The 25 percent growth in the number of residents, and changes in the composition of them, would result in private household occupancy demand growing by 32 percent by 2041, or by more than 4.5 million units over the next 28 years. Relatively high maintainer rates among the older age groups, combined with rapid growth of these older segments of the population, will result in total housing occupancy demand growing faster than the Canadian population. Changing demography will also impact the types of housing demanded. Additional demand for ground oriented units would outnumber that for apartments: specifically, 3.16 million net new ground oriented units will be required to house projected population change versus 1.36 million additional apartments. That said, the greatest relative growth would be in the apartment segment of the market: while ground oriented occupancy demand would grow by 31 percent, apartment occupancy demand would grow by 35 percent between 2013 and 2041.
Housing Occupancy Demand by Tenure Type

A distinct lifecycle pattern in housing occupancy is also seen when maintainer rates are considered by tenure. This lifecycle pattern also corresponds with major life milestones, from moving out of the familial home into rental accommodation while attending school, to labour force entry and beginning a family and entry into the ownership side of the market, and then a potential shift back towards rental accommodation through the older stages of the lifecycle.
More specifically, owned maintainer rates predominate through the family formation and rearing stages of the lifecycle, increasing from a low of only five percent of people in the 20 to 24 age group owning their home, into the range of 45 percent through family rearing, and peaking at 47 percent in the 75 to 79 group. Rates begin to decline for the 75-plus groups as some older residents elect to move out of their owned home and into rental housing or institutional environments.
With respect to the lifecycle pattern of maintaining rental accommodation, there is a significant increase through the post-secondary and labour force entry stages of the lifecycle, with rental maintainer rates going from only one percent in the 15 to 19 group to 14 percent for those aged 20 to 24 and 22 percent for the 25 to 29 segment, the highest of any age group. From this peak rates decline into the 13 to 15 percent range up to the age of 65, at which point rates again begin to increase, reaching 18 percent of people aged 80 to 84 maintaining households in rental accommodation.

Relating these lifecycle patterns of housing occupancy to projected changes in Canada’s population would see the demand for owned units increase by 39 percent between 2013 and 2041, going from 9.7 million owned units today to 13.5 million by 2041. Rental occupancy is expected to increase by 17 percent over the same period, going from 4.2 million rental units to just over five million. In absolute terms, an additional 3.8 million owned units would be required to house Canadians over the coming 28 years versus 716,752 new rental units.


Click here to download a PDF version of a summary for Canada and selected CMAs, including this one.
Click here to download a PDF version of our full report.
© 2014 Urban Futures