
The Future of Housing Occupancy: Vancouver CMA
Demographic Growth & Change

The Vancouver CMA’s population grew by 36 percent between 1996 and 2013, going from 1.79 to 2.44 million residents (651,511 additional residents). On the heels of a period of rapid growth in the early-1990s, annual rates of population growth fell into the 1.7 to 2.0 percent range through 2008. The rate of population growth continued to rise through the recent recession, reaching 2.5 percent by 2009. Since this peak, however, Vancouver’ population growth has declined each year, falling to 1.4 percent by 2013. As with other metropolitan regions, this pattern of population growth rates closely follows trends in provincial economic growth.
Accounting for the age-specific patterns of fertility, mortality, and migration and the aging of the region’s current residents, the Vancouver CMA is projected to grow by 1.05 million people over the next 28 years, from 2.44 million people today to 2.83 million by 2023, 3.22 million by 2033, and 3.48 million by 2041. In the medium-term, annual growth rates are projected to increase slightly (into the 1.5 percent range) before slowing through the latter stages of the projection period. This pattern will be driven, in large part, by a general demographic shift of the region’s population out of the childbearing age groups and into the higher mortality stages of the lifecycle.
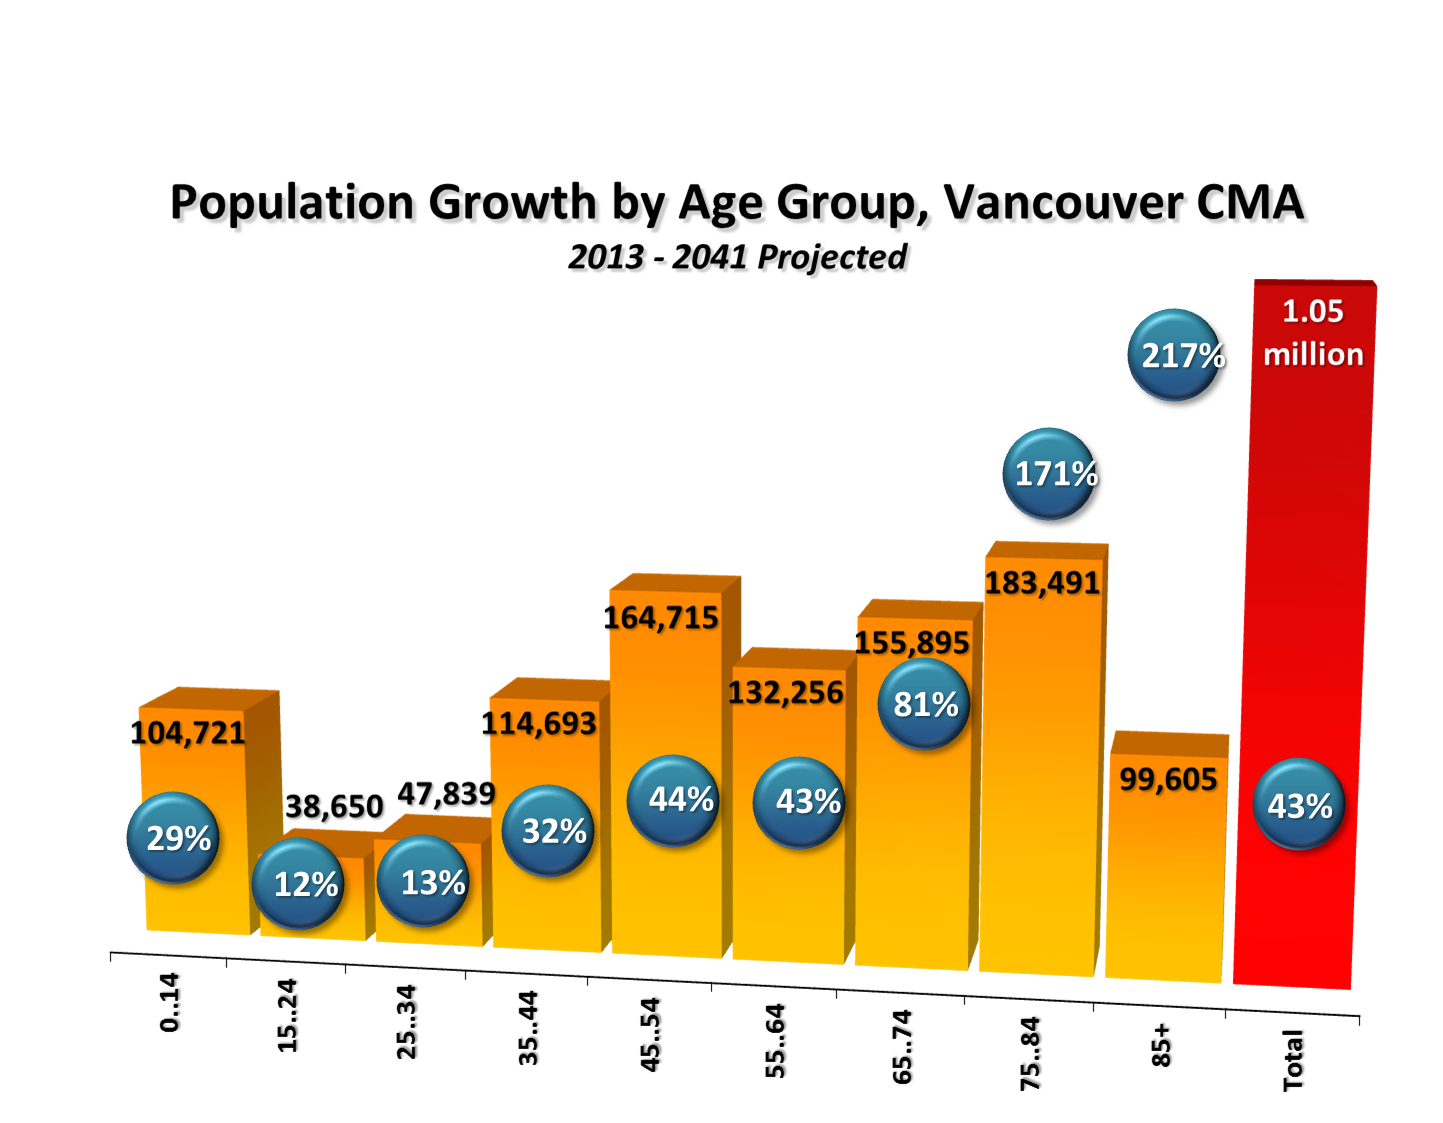
While the annual rate of population growth will moderate over time, the age composition of the Vancouver CMA’s population will continue to change significantly as the region grows. In particular, the aging of the region’s post-war baby boom generation will see the greatest growth come to the older segments of the population. All groups under the age of 45 will grow more slowly than the CMA-wide average, while those 45 and older will grow at, or well above, the rate of total population growth. Accounting for 42 percent of total population growth to 2041, the 65-plus age groups will comprise 23 percent of the Vancouver CMA’s population by 2041, up from 14 percent in 2013.
While growth in these older age groups will be important, the aging of the region’s current residents will have a significant influence on the pattern of tomorrow’s demographic change: 85 percent of 2013’s residents are projected to be alive in 2033 (and potentially still living in the region), and 77 percent would still be around by 2041.
Housing Occupancy Demand by Structure Type

The age-specific patterns of maintaining households in the Vancouver CMA show significant increases in both ground oriented and apartment maintainer rates through the younger stages of the lifecycle. For apartments, rates peak at 25 percent in the 30 to 34 year old age group, while for ground oriented accommodation they are only 20 percent for this same age group—but increase into each successively older group as apartment rates decline. The declines in apartment rates, which are more than offset by increases in ground oriented rates, highlight the prominence of the apartment market for housing entry and the ground oriented market through the family formation and family rearing stages of the lifecycle. More specifically, ground oriented rates climb from 20 percent for those in their early-30s to between 38 and 39 percent through the early-50s and 60s age groups, before declining toward 26 percent for those aged 85-plus.
Apartment rates remain steady in the range of 18 percent for people in their late-40s and 50s, after which point they increase, peaking at 26 percent of residents aged 80 to 84 maintaining a household in an apartment. It is important to note that outside of Montreal, the Vancouver CMA generally exhibits some of the highest apartment maintainer rates amongst Canada’s major CMA’s.
Combining trends in the lifecycle patterns of household maintainer rates with the pattern of demographic change projected for the Vancouver CMA to 2041 would see household occupancy demand grow by 497,320 units over the next 28 years. High maintainer rates among the rapidly-growing older age groups will see total housing occupancy demand outpace population growth over this period: 43 percent growth in total population would generate a 53 percent increase in total housing occupancy demand in the region between 2013 and 2041.

When considered in absolute terms Future additional demand would be slightly more weighted towards ground oriented housing. For example, over the next 28 years, an additional 282,188 ground oriented units would need to be added to the region to accommodate projected occupancy demand by 2041; as such, ground oriented housing would represent 57 percent of the region’s 497,320 total net additional units over this period.
Net additional demand for apartments would account for the remaining 43 percent of the region’s net housing additions to 2041, with 215,131 new apartments required to accommodate projected demand. Given the relative prominence of apartment maintainer rates when compared to other major CMAs, the roles that ground oriented and apartment housing will play in accommodating Vancouver’s growing and changing population will be much more evenly matched than in other metropolitan regions.
Housing Occupancy Demand by Tenure Type

As with the structure type lifecycle patterns of housing, the age-related pattern of household maintainer rates described by tenure correspond with major life milestones. Owned household maintainer rates in the Vancouver CMA increase rapidly through the family formation and the family rearing stages of the lifecycle, going from a low of only one percent of people in the 15 to 19 age group owning a dwelling to between 41 and 47 percent of households between the ages of 50 and 84 owning their dwelling unit. Owner-occupied maintainer rates peak at 47 percent for the 80 to 84 segment of the population before declining to 38 percent for the 85-plus age group, as some seniors either move in with family members, move out of private accommodation and into collective care environments, or shift from owned to rental accommodations.
Rental maintainer rates in the Vancouver CMA increase from one percent for 15 to 19 year olds to 22 percent for the 25 to 34 age groups. From this 22 percent peak rental rates experience a steady decline into the 13 and 14 percent range for all 55-plus age groups.

Over the next 28 years demand for owned units in the Vancouver CMA would outpace that for rented dwellings, both in absolute and relative terms. Between 2013 and 2041, the owned segment of Vancouver’s market is projected increase by 67 percent, from 621,060 units to over 1.03 million occupied units by 2041. Occupancy demand for rented units is expected to increase by 26 percent over the same period, growing from 321,997 dwellings today to 405,315 occupied units by 2041. Hence, an additional 414,001 owned units and 83,318 new rental units would be required to meet projected occupancy demand over the next twenty eight years.


Click here to download a PDF version of a summary for Canada and selected CMAs, including this one.
Click here to download a PDF version of our full report.
© 2014 Urban Futures