
Trends in Lower Mainland Housing Prices:
A 2013 Sales Update
Andrew Ramlo, Ryan Berlin & Yazmin Hernandez
The Urban Futures Institute
Click here for map of recent changes in average sales prices, or here for a map of recent changes in median sales prices.
Introduction
Here in Vancouver, often referred to as the priciest housing market in Canada, news pertaining to lofty gains in real estate are reported with fervor. Unfortunately, much of the news continues to rely on changes in average prices as a means of identifying current trends, despite the fact that these averages include extreme values at both ends of the price spectrum, thereby distorting actual market trends. Prompted by the over-reliance on average sales prices in discussions of real estate market trends, Urban Futures continues to publish an annual report that looks at all sales in the Lower Mainland region and how multi-million dollar home sales skew the overall housing picture within this market.
For example, data from last year (2012) showed that while the average sales price for all single detached properties in the Lower Mainland was $913,023, the average price net of the top price quintile was $624,701, or 32 percent below the overall average. Put slightly differently, this represents the average price for the least expensive 80 percent of sales, which—it can be argued—are more representative of the broad supply of homes that most people would consider purchasing. Similarly, while 2012 average sales prices for all attached properties, and all condo/apartment units, was $455,133 and $415,156, respectively, once the uppermost quintile was removed, prices were much lower, at $367,854 and $303,212.
Common Statistical Measures
Before we get to the numbers for 2013, it is useful to briefly define the approaches commonly used to look at changing prices. For better or worse, averages (or the arithmetic mean) have become the commonplace measure of central tendency, with the perception that they paint a middle-of-the-road picture, sufficiently summarizing a wide range of outcomes or characteristics into a single statistic (i.e. an average).
Consider, however, a community centre where one room is occupied by a number of seniors playing bridge and another is occupied by a group of children in daycare. While the average age of the people in these two rooms might be somewhere in the neighbourhood of 40, it would be erroneous at best, and misleading at worst, to use this average age to describe the range of people utilizing the community centre. The real estate context is similar in that sales are typically characterized by a wide range of sales prices within one year, in addition to significant variation between years.
Another statistical measure, which is not as adversely impacted by outliers in the data, is the median, a value in a series where an equal number of values are higher and lower than it.. To use the community centre example again, the median age could be identified by lining everyone up according to their age (lowest to highest) and identifying the age of the person who is right in the middle of the line up. Using a median measure is usually superior to using an average when considering income or real estate price distributions, where outliers have the tendency to significantly impact the average.
Another approach commonly used in considering incomes or real estate prices involves segmenting the data into equal groups (such as quintiles) and examining how the data differ between each quintile in a particular year or between different years. In the real estate context, this involves ranking all sales from lowest to highest and then creating five price groups that contain an equal number of sales (rather than just the midpoint for the median). Thus, each price range would contain 20 percent of the total number of sales in that year. This is essentially the same concept of the median, only broken up into five groups instead of only two. This update considers all three statistical measures for the 42,352 sales that occurred in the Lower Mainland region in 2013 and how they compared to previous years in terms of both volume and value.
2013 Residential Property Sales in the Lower Mainland
BC Assessment’s sales database shows that the 42,352 residential property sales in the Lower Mainland region in 2013 were 10.2 percent below the 47,178 seen in 2012. That said, while volumes were down, sales prices were up: overall, sales prices averaged $682,881 in 2013, 4.1 percent above those in 2012. Interestingly, the region’s median sales price experienced a much slower 1.2 percent increase over the past year, going from $481,000 in 2012 to $485,900 in 2013. Given the definitions outlined above, the difference between the average and median here is an indicator of the extent to which the underlying price data are skewed. In this case, 2013 residential property sales were skewed more towards the higher price points than those in 2012, with the prevalence of a few higher-priced sales pulling up the average sales price relative to the median over this period. This is more evident when the data are considered for specific property types.
Detached Properties. There were 18,124 detached properties sold in the Lower Mainland in 2013, 22 percent fewer than the 22,097 sales in 2012. On average, sales prices for detached units increased more significantly than for all sales, at 8.2 percent (going from $913,023 to $988,300). Over the same period the median sales price increased by 6.3 percent, from $685,000 to $728,000, again indicating a greater degree of activity in the more expensive segments of the market.
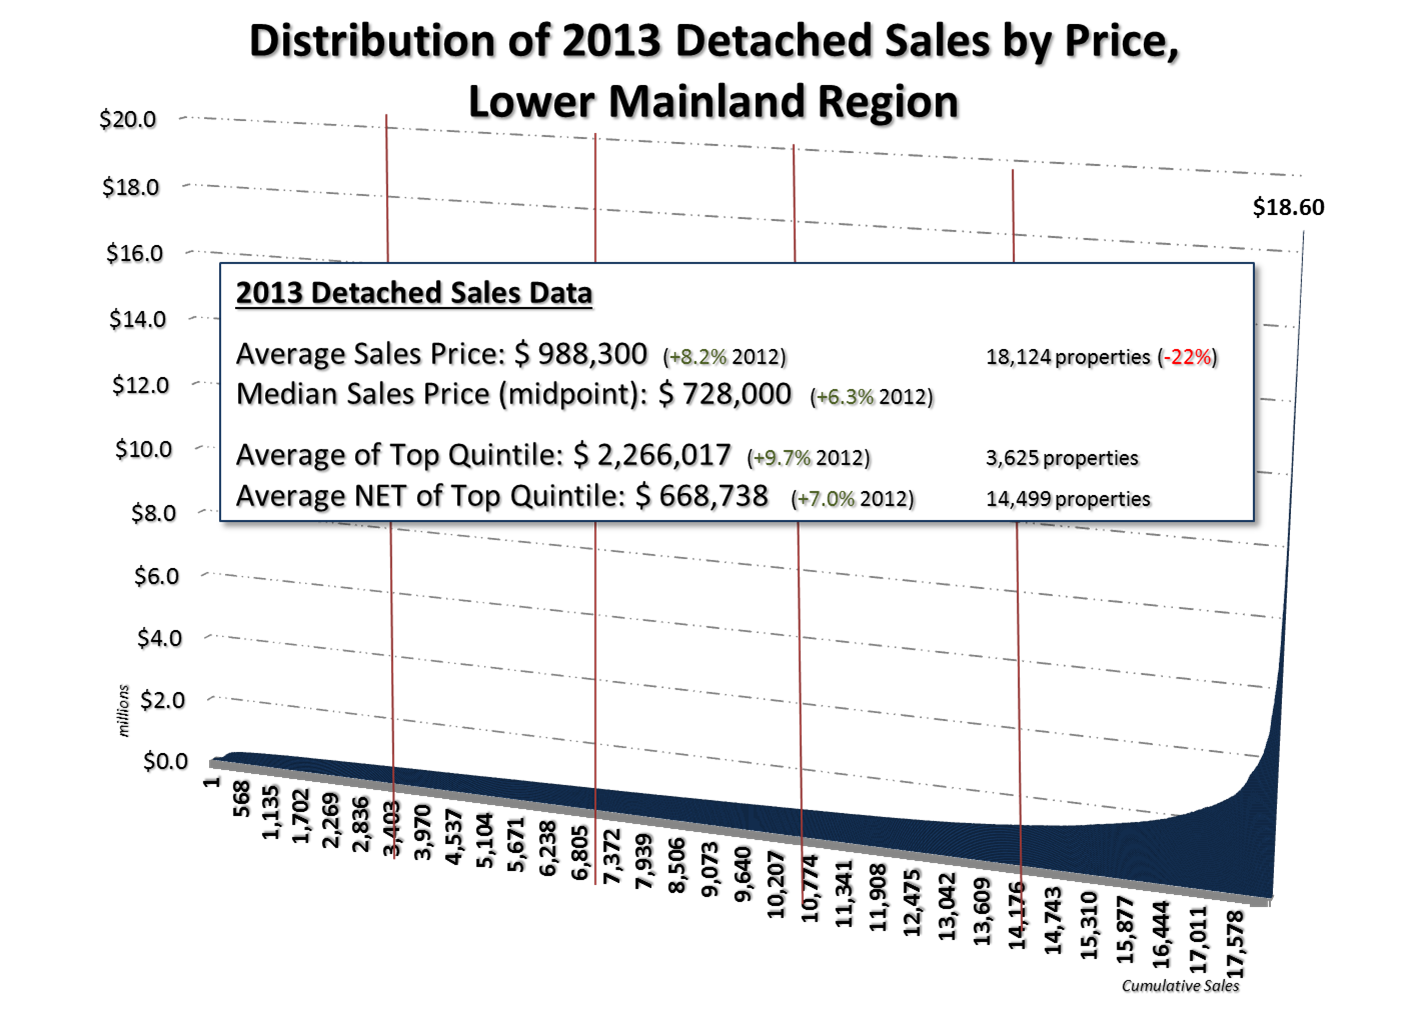
The chart to the left, which ranks the detached units that sold in 2013 from the lowest to highest price and defines delimiting them by quintile, helps to show the influence that multi-million dollar sales had on detached sales. For example, the average price for the 3,625 sales that made up the top quintile (or top 20 percent of sales by price) was $2.27 million—more than twice the average sales price for all detached properties. This is perhaps not so surprising when one considers that the upper quintile includes sales prices ranging up to $18.6 million.
The average detached sales price excluding this top quintile (that is, the least expensive 80 percent of sales), was $668,738, or 32 percent below the overall average sales price (which includes the most expensive sales).
When price changes between 2012 and 2013 are considered, average prices for the top quintile increased faster than the prices in the least expensive 80 percent of the market; 9.7 percent versus 7.0 percent respectively.

Attached Properties. There were 8,385 attached property (row homes/duplexes) sales throughout the Lower Mainland in 2013, a 1.8 percent decline from the 8,536 units sold in 2012. While year-over-year sales volumes fell, average sales prices rose: attached sales prices in the region averaged $477,693 in 2013 compared to $455,133 in 2012, a 5.0 percent increase. Over the same period, median sales prices increased less rapidly, at 4.5 percent (going from $390,000 to $407,530).
As in the detached segment of the market, ranking the sales prices for attached properties and grouping them into quintiles sheds light on the impact that the higher-priced sales have had on overall average sales prices for the attached segment of the market. More specifically, with sales prices in the upper quintile ranging up to $4.75 million, the average sales price for the most expensive 20 percent of attached sales was $852,014, almost twice the average for all attached sales in the Lower Mainland in 2013.
The average sales price for attached properties outside of the top quintile was $384,042, or 55 percent below the average of the most expensive sales (that is, the top 20 percent). When price changes between 2012 and 2013 are considered, year-over-year increases in prices were faster in the top 20 percent of the market than in the bottom 80 percent (as was seen in the detached segment), rising by 6.0 percent and 4.4 percent, respectively.

Condo/Apartments. There were 15,843 condo/apartment sales in the Lower Mainland region in 2013, down 4.2 percent from the 16,544 in 2012. As with the other property types, average condo/apartment sales prices increased between 2012 and 2013, increasing by 6.5 percent, from $415,156 to $442,086 in 2013. The past year also saw median sales prices increase, but at a slower rate of 3.3 percent, from $339,900 to $351,000.
The increase in top-end condo/apartment sales prices was more significant than in the most expensive detached or attached segments. More specifically, while the average sales price for condo/apartments that sold in the upper quintile was $862,901 in 2012, the average price of the top 20 percent of sales in 2013 was $956,884, a 10.9 percent increase. In comparison, the average price for the remaining 80 percent of condo/apartment sales increased from $303,212 in 2012 to $313,416 in 2013, a 3.3 percent increase. Thus, average sales prices for condo/apartments in the top quintile grew at three times the rate of those in the bottom 80 percent of this market over the past year, thus skewing overall average sales price changes towards the higher end of prices.
The significant increase in average sales price of the most expensive 20 percent of condo/apartments can, at least in some small part, be traced to the fact that last year’s highest-priced sale was $25.0 million—much higher than in 2012, when the most expensive condo sold for (only!) $7.24 million.
Concluding Thoughts
Price increases in the most expensive 20 percent of all property types (detached, attached, and condo/apartment) continue to skew perceptions of the overall housing market. Again, while the average sales price of all detached properties increased by 8.2 percent between 2012 and 2013 (which could be interpreted as a continued challenge within the context of affordability discussions), the price of the least expensive 80 percent of units increased more slowly at 7.0 percent. More importantly, the average sales price for detached units that almost topped one million dollars ($988,300) was almost 50 percent above the $668,738 average once the most expensive top quintile was removed.
Similarly, while the average sales price for all attached units increased by 5.0 percent, once the most expensive 20 percent of units were excluded from the calculation the increase was reduced to 4.5 percent. Perhaps the most significant difference was seen for Condo/apartments where average sales prices increased by 6.5 percent overall, but were skewed by the top end of the market growing by over 10 percent; once the top-end sales are excluded, prices increases fell to 3.4 percent. Relative to an overall average of $442,086 for condo/apartment sales, the average for the bottom 80 percent of sales in 2013 was only $313,416.